For campaigns

U.S. maps.

From a Claude prompt.

It's CNN's John King and his magic wall — if it had a baby with Claude.

Draw your own boundaries and compare demographics across any regions — states, districts, counties, all the way down to the precinct — just by asking. Pre-loaded U.S. boundaries, Census data, and 2016 / 2020 / 2024 election results, native to Claude, Cursor, and Claude Code over Model Context Protocol. Every published map ships with an embed iframe, a static image, and a machine-readable citation block.

What teams build with mapsmcp · scroll →

7 maps · live thumbnails

Live · try it

Drop any U.S. address. See every layer.

Geocoded coordinates → state → county → congressional district → state-leg districts → ZIP code area → Census tract → school district → voting precinct. For each: 58 federal demographics (race & ethnicity, full income distribution, poverty, SNAP, rent burden, education, employment, commute mode & travel time, foreign-born, veterans, broadband) plus every public dataset we host — NYT 2024 precinct & county results, Cook PVI, DW-NOMINATE, 538, ACS. Logged-in workspaces add their own ingested data too.

or try

The compose-and-publish flow

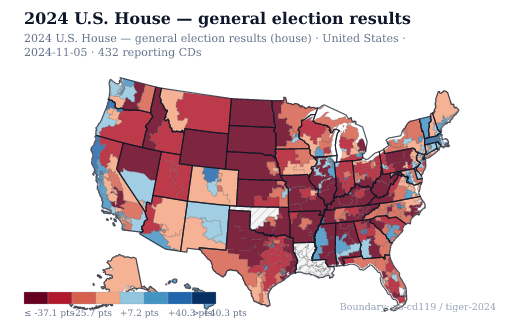
Five calls. One citable map.

Every threshold in the filter is printed verbatim in the caption. freeze=true snapshots the underlying datasets at publish time, so the embed stays valid even when the Census or election data is later revised.

// 1 — Find 2024 swing states (≤ 5pt margin)
classify_states({ cycle: 2024, margin_pct: 5 })
  → ["AZ","GA","MI","NV","NH","NC","PA","WI"]

// 2 — Resolve "low income" to a stable threshold using Census data
demographic_bands({
  dataset_slug: "acs-county-mhi-2023",     // median household income (Census)
  field: "B19013_001E",                    // Census variable ID
  method: "quintile",
})
  → bottom-quintile cutoff: $52,140
  → top-quintile cutoff:    $98,720

// 3 — Compose the filter, get a sample + caption
query_counties({
  filter: {
    state_in: [...swing],
    winner_party: "REP",
    margin_pct_abs_lte: 10,
    demographic_band: {
      dataset_slug: "acs-county-mhi-2023",
      field: "B19013_001E", band: "Q1",
    },
  },
  order_by: "margin asc", limit: 500,
})

// 4 — Wrap it in a view config
create_map_view({ result_set_id, style: "choropleth_margin" })

// 5 — Mint /v/<slug> + iframe + .png + citation.json
publish_map({ view_id, freeze: true })
Rendered citable map
/v/nc-close-trump-precincts-2024 nc-close-trump-precincts-2024.png · citation.json · embed iframe
Frozen at publish Stable URL 5,000-row hard cap

Same toolkit, eight industries

What teams build with mapsmcp

Eight worked examples. Each card links to the full walkthrough — the actual MCP calls, the dataset shapes, the produced artifact.

Score candidate store sites
Retail & consumer brands

Score candidate store sites

Drive-time trade areas, Census demographics, and your competitor list — all in one workflow. Rank 12 sites in minutes.

bulk_match_addresses · geo_isochrone · census_acs
Exposure inside hazard zones
Insurance

Exposure inside hazard zones

Pull a FEMA flood-zone or wildfire-perimeter polygon, intersect it with your policy book, and sum the premium at risk. Refresh weekly.

ingest_geojson · geo_intersect_dataset · describe_report
Provider-network gap analysis
Healthcare

Provider-network gap analysis

Patient roster + drive-time areas + Census health-equity data. Find ZIP codes that are under-covered today.

geo_isochrone · census_acs · geo_hotspot
Same-day coverage gaps
Logistics

Same-day coverage gaps

Drive-time service-area polygon per depot, merged across your fleet, then subtracted from a region to find the gaps.

geo_isochrone · geo_union · query_shapes_by_intersection
Comp-set demographics
Real estate

Comp-set demographics

Demographics within a 20-minute drive of any listing. Branded embed on maps.yourbrand.com.

geo_isochrone · query_shapes_by_intersection · census_acs
Reproducible multi-vintage analysis
Research

Reproducible multi-vintage analysis

Compare Census tables across 2010 / 2015 / 2020. Version-pinned boundaries and a citable URL in your appendix.

census_acs · compare_shape_versions · build_geojson
Election-night maps in 90 seconds
Civic & journalism

Election-night maps in 90 seconds

Pre-loaded county results, one click to render, drop the embed iframe into your newsroom's content management system.

ingest_county_pres · create_report · describe_report
Donor density by district
Political ops

Donor density by district

Geocode 10,000 donor addresses, join them to the 119th Congress, render a district map in under a minute.

bulk_match_addresses · lookup_district_for_address · render_dot_density

What every workspace gets · Free included

Pre-loaded. Pre-joined. Pre-versioned.

No CSV downloads. No projection wrangling. No matching boundaries to vintages by hand. The whole catalog is queryable, joinable, and renderable on the Free tier.

56
states + DC + territories
tiger-2024
3,235
counties · 4 vintages
2010 · 2015 · 2020 · 2024
441
congressional districts · 6 Congresses
113th – 119th
1,964
state-leg upper-chamber districts
tiger-2024
4,879
state-leg lower-chamber districts
tiger-2024
84,415
Census tracts
tiger-2024
33,791
ZIP code tabulation areas
tiger-2024
10,892
unified school districts
tiger-2024

One-call data pulls

  • census_acs
    Any Census American Community Survey variable, any year, any boundary level
  • ingest_county_pres
    2016 / 2020 / 2024 presidential results per county
  • ingest_cook_pvi
    Cook Partisan Voting Index joined to the matching Congress
  • ingest_voteview
    Voteview ideology scores for every member of Congress
  • ingest_dime
    Bonica donor-ideology data per district
  • ingest_geojson
    Any public GeoJSON URL becomes a queryable workspace boundary set
  • bulk_match_addresses
    10,000 addresses per batch · free Census geocoder · joined to your boundaries in one call
  • geo_isochrone
    Drive / walk / bike-time areas around any location

Pricing

Start free. Pay if you publish.

Free tier covers compose, query, and create_map_view end-to-end. publish_map is the only premium-gated call.

Free

$0/month
  • 50 calls / month
  • 0 premium calls
  • 10 MB datasets
  • 1 public report
  • Maps MCP footer on embeds
Start free

Pro

$50/month
  • 50,000 calls / month
  • 250 premium calls / month
  • 1 GB datasets · unlimited reports
  • Origin-allowlist · no footer
  • 25 sub-workspaces (agencies)
Pick Pro

Pay-as-you-go above caps: $0.0002 per standard call · $0.04 per premium call.
Full pricing & FAQ →

Get started

60 seconds from here to your first map.

Paste the MCP config into your client. Drop the API key from the form on the right. Run your first prompt.

MCP config

{
  "mcpServers": {
    "mapsmcp": {
      "type": "http",
      "url": "https://mapsmcp.com/mcp",
      "headers": { "Authorization": "Bearer YOUR_API_KEY" }
    }
  }
}

Claude Desktop reads ~/Library/Application Support/Claude/claude_desktop_config.json (macOS). Cursor, Cline, Zed, the Anthropic SDK, and raw cURL: full setup guide.

Claude Code skill

curl -fsSL https://mapsmcp.com/.claude/skills/mapsmcp/SKILL.md \
  -o ~/.claude/skills/mapsmcp/SKILL.md

One curl. Claude Code auto-triggers the skill on any U.S.-geography question.

Free workspace · 50 calls / month